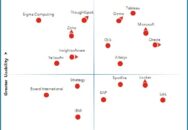
Tableau: valuing data visualization
The world of data analytics and business intelligence (BI) is heavily urbanized, consisting of several layers of solution offerings across wide ranges of functionality and usability with no solution residing alone in terms of either measure. Tableau deals in data analytics and visualization facilitated through the solution’s own querying language. While analytics have their base-level of universal benefits, Tableau’s approach to data visualization combined with the company’s VisQL native language queries provide customers with increased data visibility across multiple data types, increased productivity accessing and sharing filtered analytics, and reduced burden on IT and data analysts.